Customer Churn Prediction Model Comparison –
Tableau Dashboard
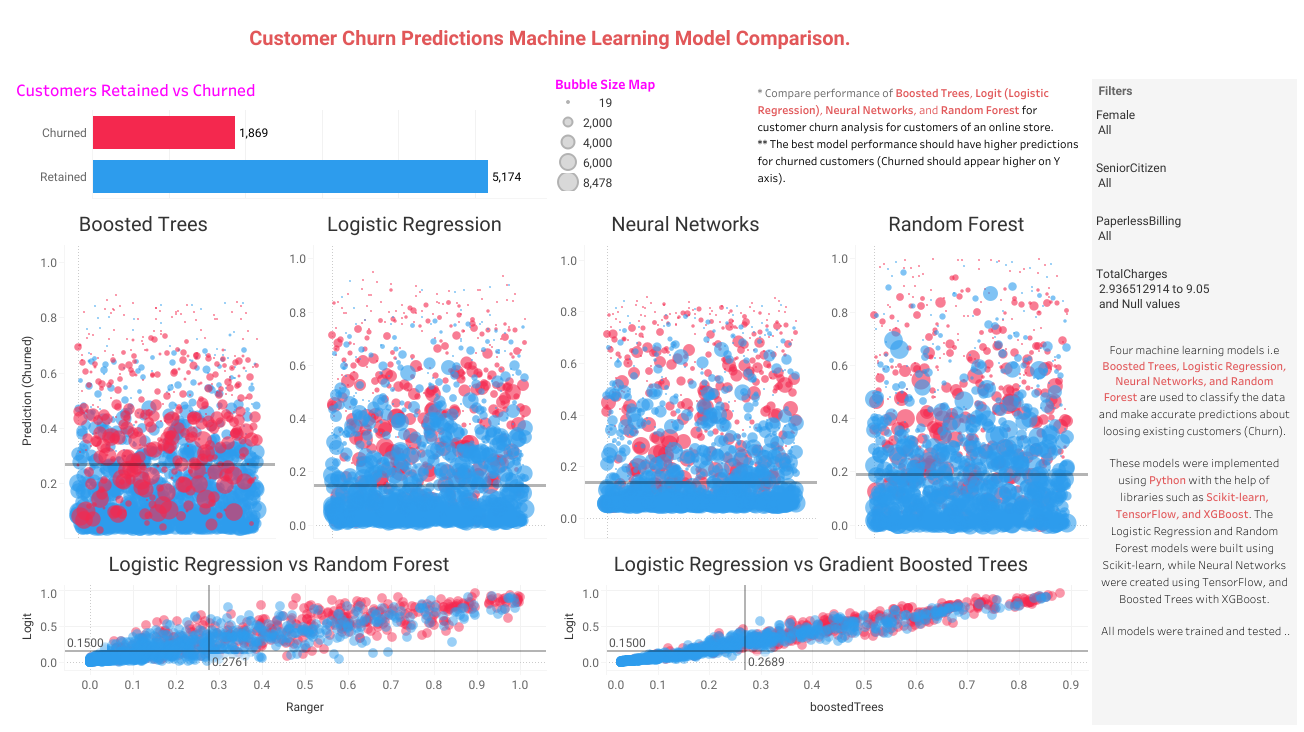
Losing existing customers (churn) is one of
the most concerning issues for businesses,
directly impacting revenue and growth.
The client wanted to develop churn
prediction models using different machine
learning algorithms and compare them
graphically.
To address this, we developed a Tableau
dashboard that visualizes and compares the
performance of multiple machine learning
models for churn prediction.
By integrating model outputs from Python
into Tableau, the solution provided
management with a clear, interactive view of
churn probabilities across models.
Project
Highlights
- Model Integration: Trained
and evaluated four machine learning
models — Boosted Trees, Logistic
Regression, Neural Networks, and
Random Forest — using Python with
Scikit-learn, TensorFlow, and
XGBoost.
- Performance Comparison
Dashboard: Designed a
Tableau dashboard to visualize churn
probabilities across models with
bubble plots, logit comparison
charts, and color-coded
outcomes.
- Interactive Filters:
Implemented dynamic filters for
gender, seniority, and billing
method to allow segmentation of
churn insights by customer
attributes.
Business Impact
- Optimized Retention Strategy:
Empowered the client to adopt the
most effective churn prediction
model for their business case.
- Targeted Customer Engagement:
Identified at-risk groups, enabling
more personalized and effective
campaigns to retain those
customers.
- Decision Support: Provided an
intuitive comparison tool that
translated complex model outputs
into insights accessible to
non-technical decision-makers.
Tools &
Technologies
- Python: Scikit-learn,
TensorFlow, XGBoost for machine
learning model development
- Tableau: Dashboard design and
interactive visualization