Sales Strategy Dashboard – Tableau Insights
                                    for Sales Growth Trends


                                    In today’s competitive sales landscape,
                                    businesses need real-time visibility into
                                    sales and profitability to adapt quickly and
                                    drive growth.
                                    To meet this need, we developed an
                                    interactive Tableau dashboard that tracks
                                    sales performance across regions, product
                                    categories, and customer segments.
                                    By integrating and cleaning data from ERP
                                    systems and sales platforms through SQL, the
                                    solution transformed raw sales data into
                                    actionable insights that highlight
                                    profitability trends, regional performance,
                                    and sales efficiency.
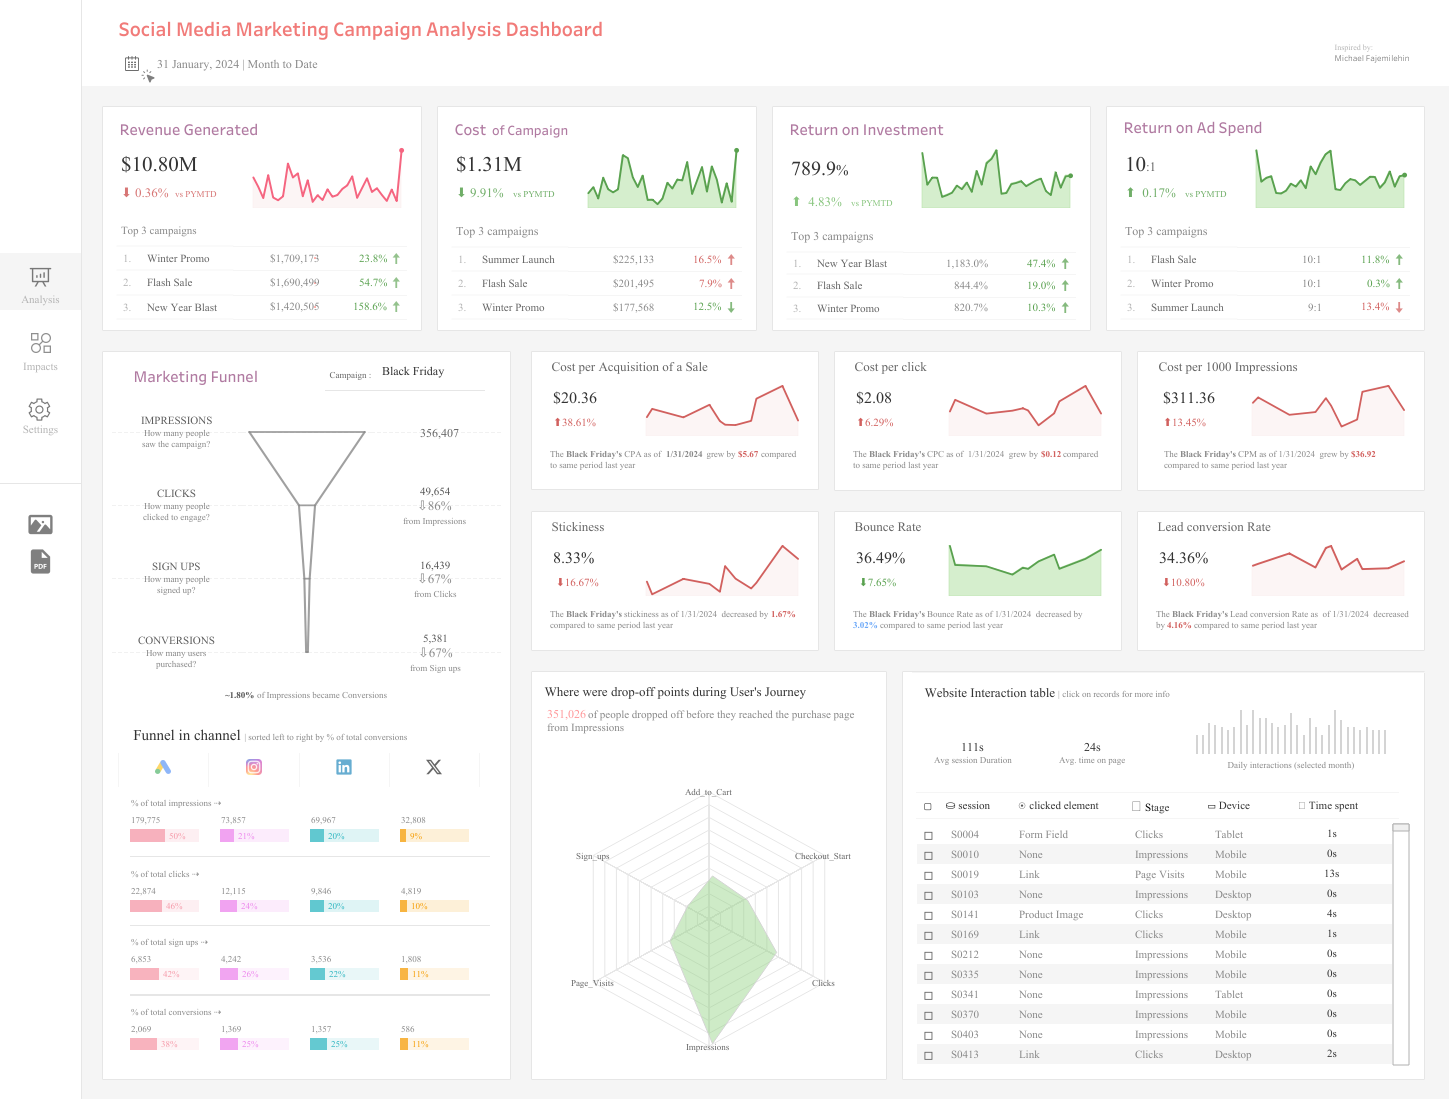


                                    Dashboard
                                        Features
                                    
                                        - Topline Metrics Overview:
                                            Summarizes core KPIs such as sales,
                                            profit, order volumes, and profit
                                            ratio, with trend indicators to
                                            monitor performance shifts over
                                            time.
 
                                        - Profit Ratio Growth by
                                                Category: Visualizes
                                            profitability trends across product
                                            categories and sub-categories,
                                            identifying areas of strong growth
                                            and potential decline.
 
                                        - Sales by Region & Segment:
                                            Breaks down sales performance across
                                            regions and customer segments,
                                            helping to compare target
                                            achievements and contribution
                                            levels.
 
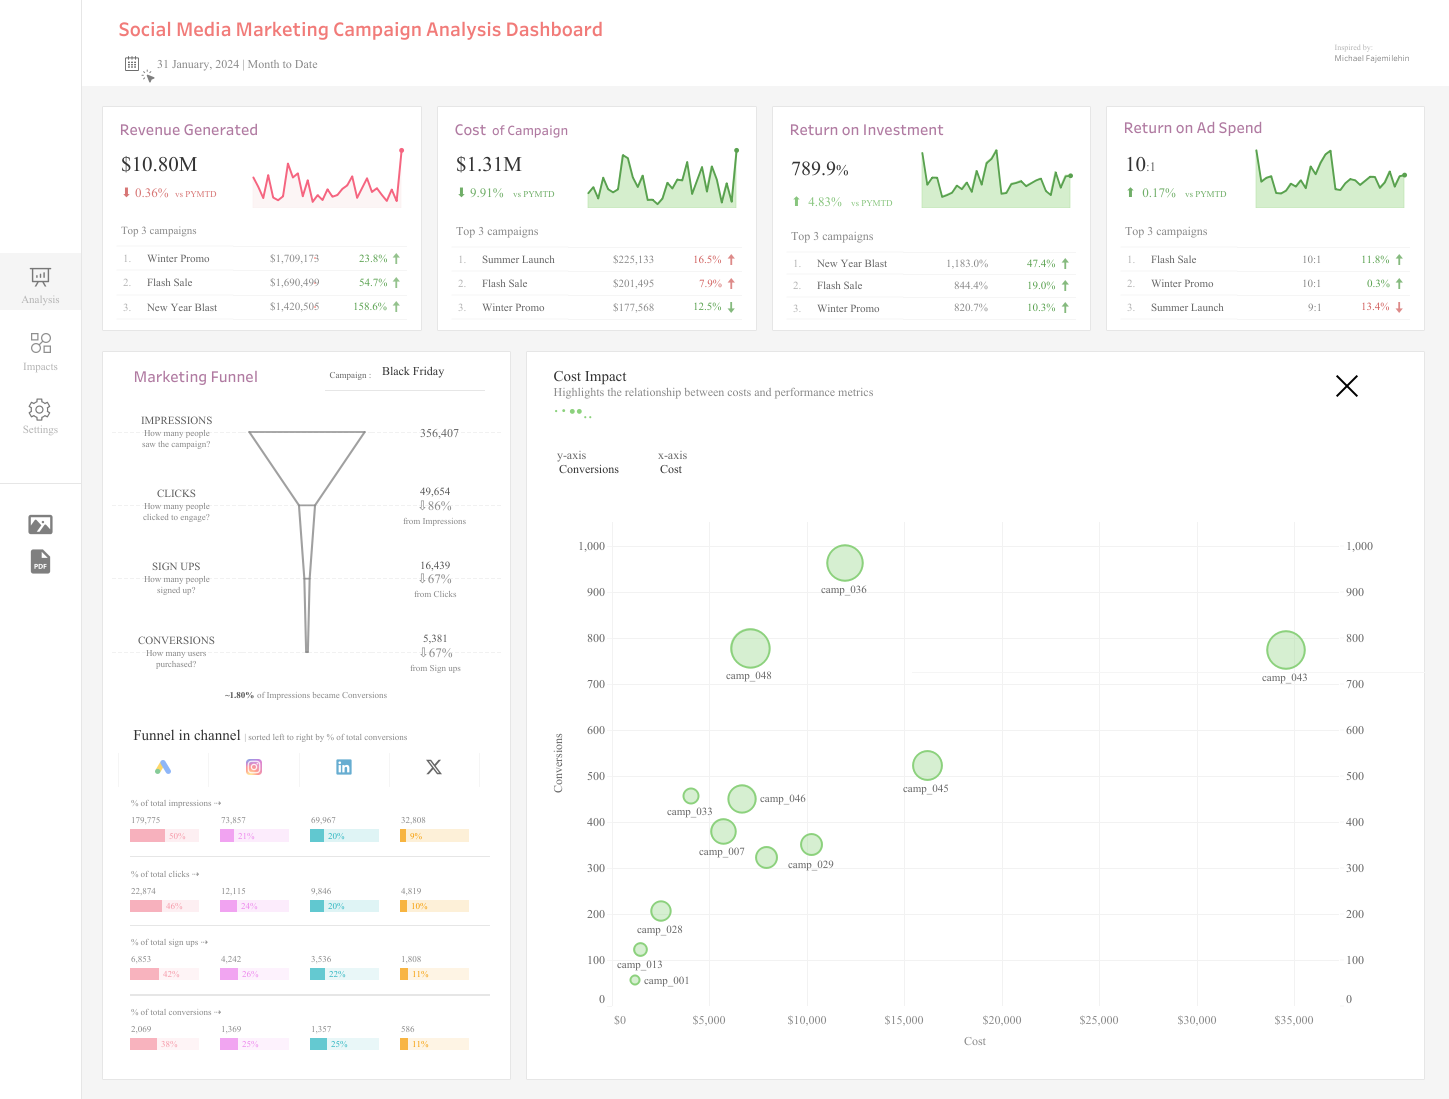
                                        - Performance Benchmarking:
                                            Uses heatmaps and comparative
                                            visuals to highlight top-performing
                                            regions and underperforming product
                                            lines.
 
                                        - Trend vs. Topline Toggle:
                                            Allows users to switch views for
                                            either high-level summaries or
                                            detailed trend analysis, enabling
                                            flexible decision-making.


                                    Project
                                        Highlights
                                    
                                        - Data Integration: Integrated
                                            ERP and sales data using SQL,
                                            ensuring clean, consistent inputs
                                            for analysis.
 
                                        - Regional & Segment Insights:
                                            Designed visuals to compare
                                            performance across geographies and
                                            customer types.
 
                                        - Profitability Tracking:
                                            Identified high-growth categories
                                            and sub-categories and
                                            underperforming product lines to
                                            guide sales strategies.
 
                                        - Automated Reporting:
                                            Eliminated manual monthly reporting
                                            by building self-updating Tableau
                                            visuals that can be downloaded as a
                                            PDF file.


                                    Business Impact
                                    
                                        - Improved Sales Strategy:
                                            Enabled the client to align
                                            resources with profitable regions,
                                            products, and customer
                                            segments.
 
                                        - Faster Decision-Making:
                                            Provided real-time performance
                                            monitoring, reducing delays in
                                            strategy adjustments.
 
                                        - Profit Optimization: Helped
                                            client increase profitability by
                                            identifying growth opportunities and
                                            addressing declining
                                            categories.


                                    Tools &
                                        Technologies
                                    
                                        - SQL: For data integration and
                                            preparation
 
                                        - Tableau: For interactive
                                            visualization and business
                                            storytelling